Compare agents and export results
Choose a comparable scope, interpret the Analytics view responsibly, and export a portable review snapshot.
Agent Comparison in Analytics puts selected agents side by side over a defined set of completed, accessible runs. Use it to find a difference worth investigating—not to replace the run-level audio, transcript, and metric evidence that explains it.
Choose the scope that answers your question
| Scope | Choose it when | Select | Watch for |
|---|---|---|---|
| Time | You want a broad trend over the same period. | All, 7d, or 30d. | A period can mix scenarios, callers, or configurations. |
| Suite | You want to compare planned test work. | At least one suite for every selected agent. | Choose suites that test comparable scenarios and setup. |
| Call | You need a focused comparison of known individual results. | At least one completed call for every selected agent. | A few hand-picked calls are useful for diagnosis, not a broad performance claim. |
The UI supports up to ten selected agents. That is a selection limit, not a recommendation that ten agents—or any fixed number of calls—is a statistically useful sample.
Create a comparison
- Open Analytics and find Agent Comparison.
- Use + Add agent to select the agents to compare. Start with agents that handled comparable work.
- Choose Time, Suite, or Call.
- For Time, choose All, 7d, or 30d. For Suite or Call, select at least one item under each selected agent; the comparison waits until every agent has scope coverage.
- Review the loaded summary cards, rubric rows, and metric rows. Expand a rubric to inspect its metric averages.
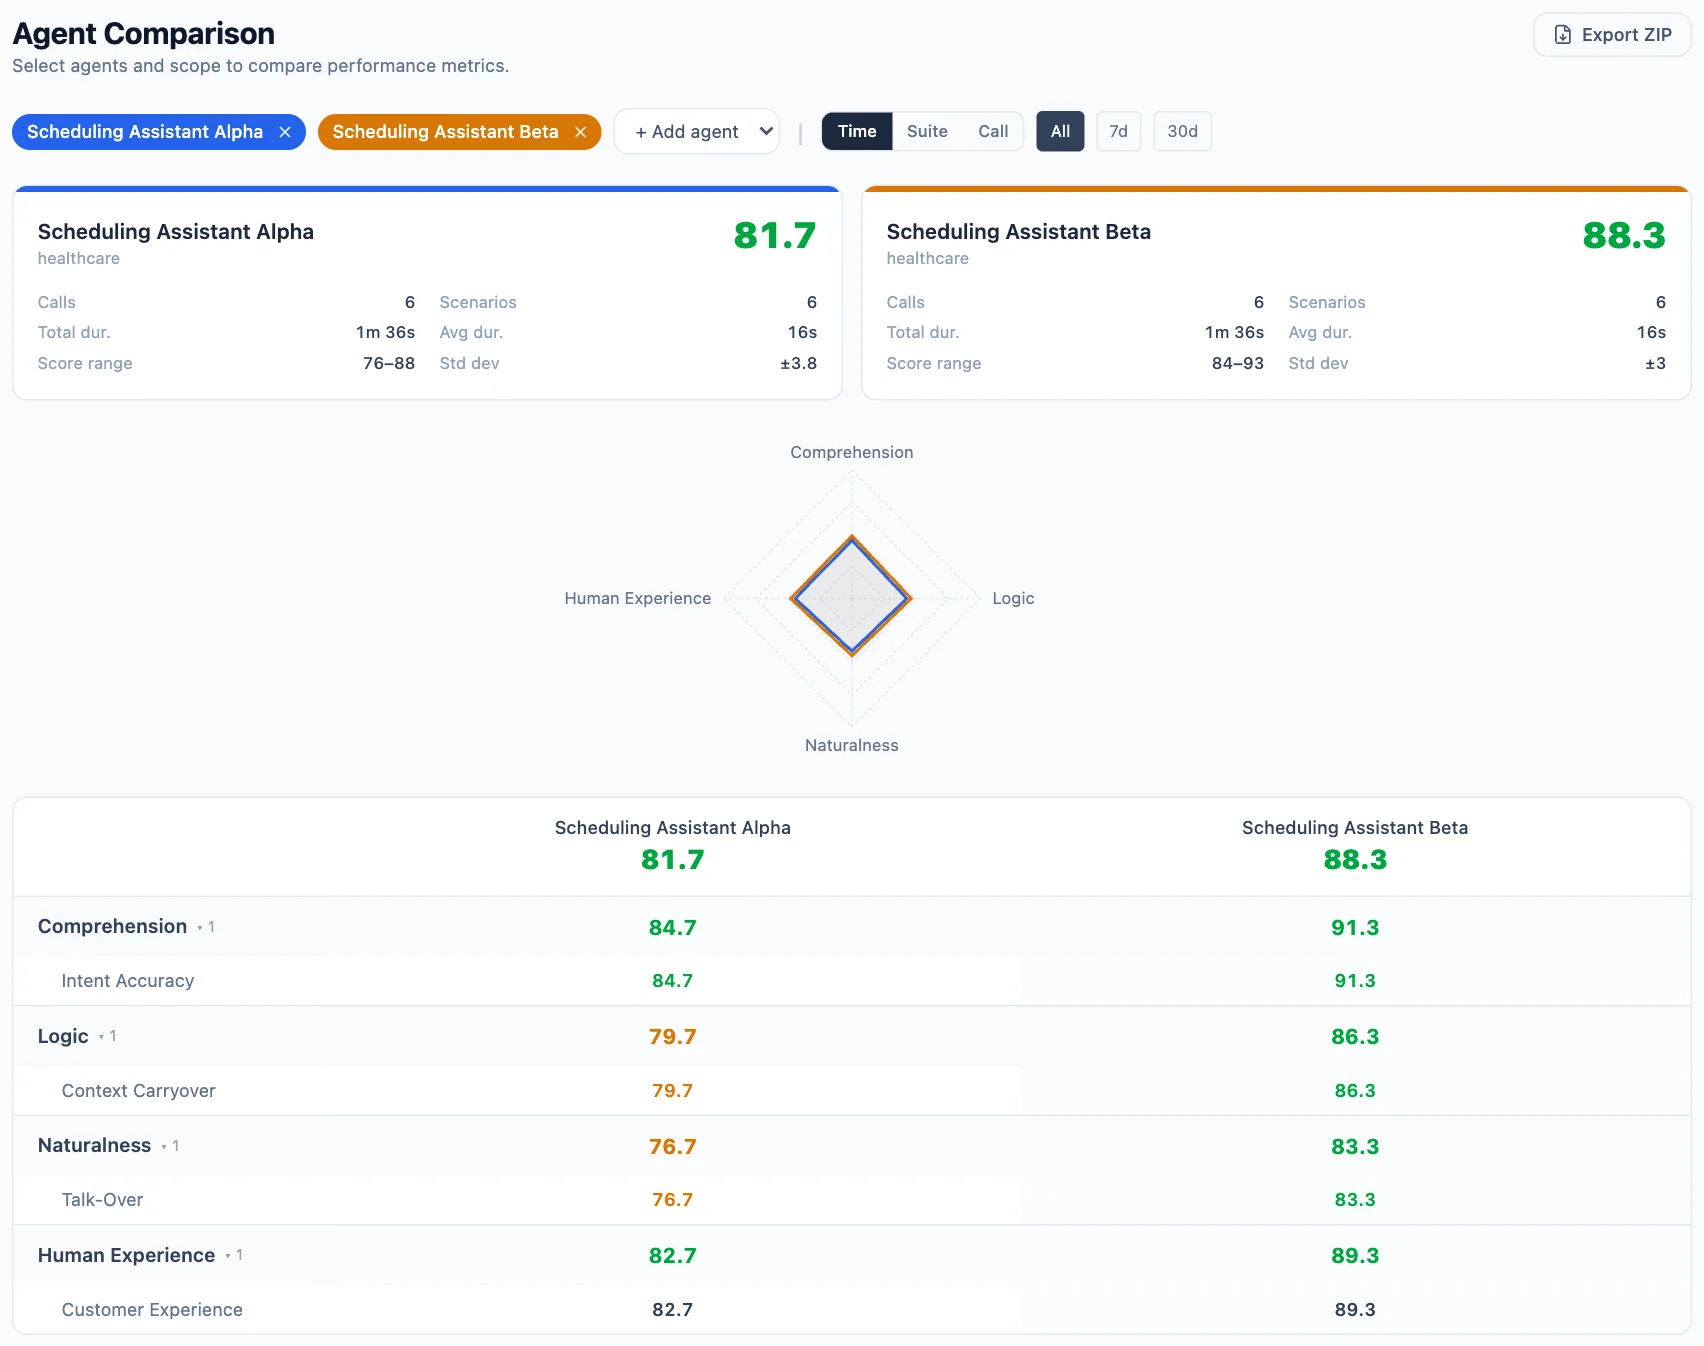
A synthetic Time-scope comparison combines sample counts and spread with rubric and metric averages.
Read the result as a sample, not a verdict
The summary cards show the number of included calls, overall score range, and standard deviation. The comparison table shows average scores for the overall result, rubrics, and available metrics; a dash means that result is unavailable for that agent in the selected scope.
Read these together:
- Average shows the center of the included results, but can hide inconsistent calls.
- Spread (the score range and standard deviation) shows whether the results cluster or vary widely.
- Sample count tells you how much evidence the average represents. A small sample, or samples that use different scenarios or conditions, weakens a conclusion.
- Missing results are not zeros and should not be used to declare an agent better or worse. Check the individual calls to learn whether a metric was not applicable, needed setup, or could not be scored.
Correlation in this view is not causal proof. If one agent has a higher average, investigate comparable calls and their evidence before attributing the difference to a prompt, configuration, or model change.
Worked example: investigate an apparent regression
Suppose a team compares Scheduling assistant v1 and Scheduling assistant v2 using Suite scope. They select the same appointment-booking scenario suite for each agent, with six completed calls per agent. The comparison shows v2 with a higher overall average, but a wider score range and a lower average for one comprehension metric.
The useful next step is not to declare v2 better. The team expands the rubric, opens the included calls with the low comprehension results, and checks the recording, transcript, and metric detail. If those calls share a new scenario variant, the team can run a matched follow-up suite before deciding whether the change helped.
Success signal: the comparison gives the team a clearly scoped difference, its sample count and variability, and the exact calls to inspect next.
Export a review snapshot
When a comparison has loaded, select Export ZIP. The downloaded ZIP contains a self-contained index.html comparison report and a report/ folder with the selected scope's per-recording presentation. The report includes the comparison overview, available charts and metric table, and the calls included for each agent.
Use the ZIP to share a portable snapshot of the selected comparison. It is not a generic raw-data export, and it does not replace the underlying call evidence. Return to the individual runs when a reviewer needs the recording, transcript, configuration, or detailed metric reasoning.
Compare individual runs and export a PDF
From a completed run, select Compare, choose the runs to place alongside it, and use the first column as the base for the displayed changes. This direct run-to-run comparison is for inspecting specific evidence; it is separate from Analytics' broader agent comparison. Select PDF in that comparison to open the printable report and save or print it as a PDF.
Download an offline suite report
From a suite, select Download report. The download is an offline ZIP report for that suite. Where the report picker is available, the current suite is included and you can select additional suites to combine into one bundle before downloading.
Limitations and tradeoffs
- Analytics compares the completed runs available within the chosen scope; it does not make unlike scenarios, setups, or sample sizes directly comparable.
- The comparison view covers the available Comprehension, Logic, Naturalness, and Human Experience results. It does not present every possible suite dimension as a comparison family.
- Averages and highlighted best values describe the selected data only. They do not establish causation or predict future calls.
- Incomplete scope coverage, unavailable metrics, and small or mismatched samples require run-level review before a decision.